Today’s topic: NDVI. This is another post that started life as a thread over on mastodon.
What the heck is that? It’s an acronym (sorry) it stands for normalized difference vegetation index. Short version it’s a proxy for how much healthy plant life there is.
It will be a number between -1 and 1. -1 being a clean concrete slab or similar. 1 being an impossibly healthy rainforest canopy.
The way this one works is comparing the difference between absorption of near infrared light and red light.
Because plants leaves are green, this means their leaves absorb all the red and blue light. The atmosphere just about let’s the same amount of red and near infrared light (nir). But plants don’t absorb the nir light. See how the line drops off in the chart below.
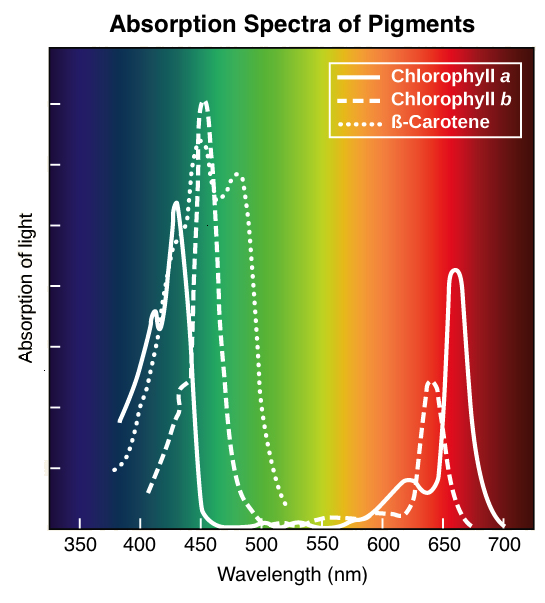
So by comparing the values we can see how much healthy plant life there is.
We can convert this into a number with a generic formula. (A-B)/(A+B) This ends up with a ratio of one to the other between -1 and 1. This is where the normalized part of the name comes from. There are many versions of this formula for finding all sorts of different things, water, water turbidity, etc.
The great thing is this is all very easy to calculate on satellite images. The formula applies to each pixel independently. So you do them all in separate threads if you wanted. Making this very very fast with tools like dask or spark. Even numpy can do this pretty dang quick on most reasonably sized images.
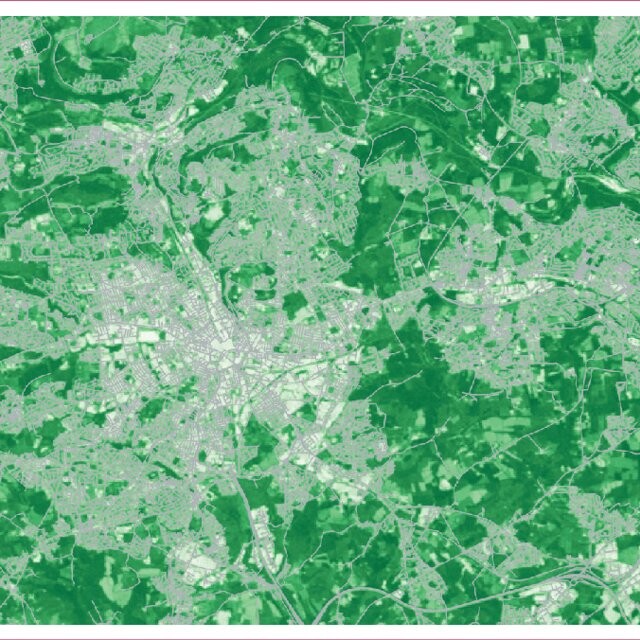
As you can see in the image above its pretty easy to find fields or parks compared to buildings and structures. Its used for all sorts of applications from crop monitoring, deforestation, city growth.
Any questions feel free to ask on mastodon