For the last ${scairy_number_of_years} years I’ve been working on some library tooling to create SVG files using rust. There are some libraries that existed already but they either didn’t work for what I needed to do or they had limitations. So I build two libraries of my own. Polygonical and ESVG. Polygonical focuses on 2d geometry operations. Points, lines, polygons and doing things to them. It does not concern its self with how they are shown, what format they are written to disk or anything like that. Its job is to make handling geometries easy. ESVG is a Document Object Model (DOM) based svg creation library, while it can read an svg it is mostly designed to build an svg in memory and write it out to disk or some where else.
Originally both of the libraries were inside another project that is used to create pages of shapes for my wife’s etsy shop. However I realized they were useful for other things and wanted to be able to use them in different projects. So a great extraction and refactoring occurred and two new libraries were born.
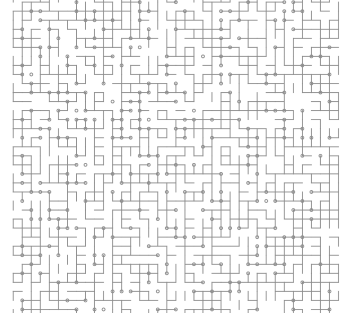
Recently I’ve been playing with procedual and random generation to create interesting patterns and realized this would make a good introduction tutorial to both libraries. This is what we are going to be aiming to create
Assumptions
- You know some rust
- You have a rust coding environment set up
- You know a little about the SVG format. I wrote a very basic intro a few years ago
Creating a blank SVG
While we work we are going to want to see some stuff. This kind of thing I find easier to debug visually. So lets start by creating a blank svg document. A bit like a hello world.
First up create the project and add esvg and polygonical to the project.
cargo new svg_patterns
cd svg_patterns
cargo add esvg
cargo add polygonical
Now we need to add the document creation and file handling. Open the main.rs file, it should look like this
fn main() {
    println!("Hello, world!");
}
There are two things we need to define before we can create a document. The first is the Dots Per Inch (DPI) we will be using. This defines the number of pixels per inch of space we will end up with in the final image. Common DPI values are 96 for things appearing on screen, 72 for some cutting machines, or around 300 for print work. For this I’m going to set it to 96. The second thing we need is a definition of the “paper” we are going to be drawing on. I’m not american so I’m going to pick A4, but esvg has support for a range of paper sizes and custom ones.
use esvg::page::Page;

const DPI: i32 = 96;
fn main() {
    let page = Page::A4(DPI);
}
Now we can create our document.
use esvg::page::Page;

const DPI: i32 = 96;
fn main() {
    let page = Page::A4(DPI);
    let document = esvg::create_document(&page);
}
Finally we can write our document to a file.
use esvg::page::Page;

const DPI: i32 = 96;
fn main() {
    let page = Page::A4(DPI);
    let document = esvg::create_document(&page);

    esvg::save("output_path.svg", &document).expect("Could not save SVG");
}
Obviously this could could do with some improvements, but it proves the point. When run it will create a svg file in the working directory called output_path.svg that will look like this internally
<?xml version="1.0" encoding="UTF-8"?>
<!DOCTYPE svg PUBLIC "-//W3C//DTD SVG 1.0//EN" "http://www.w3.org/TR/2001/REC-SVG-20010904/DTD/svg10.dtd">
<svg height="297.1270833333333mm" viewBox="0, 0, 794, 1123" width="210.07916666666668mm" xmlns="http://www.w3.org/2000/svg" xmlns:xlink="http://www.w3.org/1999/xlink" />
This doesn’t do much. It sets up the doc type, and root svg tag, along with a couple of common namespaces.
It is usually worth setting some default style up on the root tag so that anything inside your image that doesn’t have a style explicitly set will get something. Lets pull document creation out into a function.
use esvg::Element;
use esvg::page::Page;

const DPI: i32 = 96;

fn main() {
    let page = Page::A4(DPI);
    let document = create_document(&page);

    esvg::save("output_path.svg", &document).expect("Could not save SVG");
}

fn create_document(page: &Page) -> Element {
    let mut doc = esvg::create_document(page);
    doc.set("stroke", "#8c8c8c");
    doc.set("fill", "none");
    doc.set("fill-opacity", "1");
    doc.set("stroke-opacity", "1");
    doc.set("stroke-width", "0.5mm");
    doc.set("stroke-linejoin", "miter");
    doc.set("stroke-dasharray", "none");
    doc.set("stroke-linecap", "square");
    doc.set("stroke-miterlimit", "10");
    doc.set("stroke-dashoffset", "0");
    doc.set("color-rendering", "auto");
    doc.set("color-interpolation", "auto");
    doc.set("text-rendering", "auto");
    doc.set("shape-rendering", "auto");
    doc.set("image-rendering", "auto");

    doc
}
I orgiginally cribbed most of these settings from what inkscape generates when you create a new image. The important ones are near the top. stroke controls the colour of the lines, fill controls the colour used inside shapes, fill-opacity and stroke-opacity control how transparant a shape is, they are a number between 0 for completely clear and 1 for completely solid. stroke-width controls how thick the paramiter line is. You can use any units here, if you don’t provide units it will be in pixels. The rest are not so important and can be ignored mostly. If you need to look one up mozilla provide excellent svg reference docs.
If we run the code now we’ll get, but it’ll still look like a blank page.
<?xml version="1.0" encoding="UTF-8"?>
<!DOCTYPE svg PUBLIC "-//W3C//DTD SVG 1.0//EN" "http://www.w3.org/TR/2001/REC-SVG-20010904/DTD/svg10.dtd">
<svg color-interpolation="auto" color-rendering="auto" fill="none" fill-opacity="1" height="297.1270833333333mm" image-rendering="auto" shape-rendering="auto" stroke="#8c8c8c" stroke-dasharray="none" stroke-dashoffset="0" stroke-linecap="square" stroke-linejoin="miter" stroke-miterlimit="10" stroke-opacity="1" stroke-width="0.5mm" text-rendering="auto" viewBox="0, 0, 794, 1123" width="210.07916666666668mm" xmlns="http://www.w3.org/2000/svg" xmlns:xlink="http://www.w3.org/1999/xlink" />
Lets draw something. The page we created at the start has helper methods to give the pixel locations of various points, top left corner, bottom right, etc. Lets draw a line across the page.
fn main() {
    let page = Page::A4(DPI);
    let mut document = create_document(&page);

    let line = esvg::path::create(&[page.top_left(), page.bottom_right()]);
    document.add(&line);

    esvg::save("output_path.svg", &document).expect("Could not save SVG");
}
(note I’ve only included main now to save space)
The path module in esvg provides helpers for creating path elements. In this case we pass in a slice that contains the coordinates we want to draw between. Note that the top_left method and its siblings all follow the margins applied to the page. They default to half an inch. If you need to control the margins you can use the A4_with_boarder and similar functions.
One thing to note, when you add an element to a parent element it is cloned into the dom tree. Changes made to the element after it has been added will not be applied to the version that gets saved at the end. This is due to the DOM tree needing to take owner ship of the element to make sure it doesn’t vanish when the original element variable goes out of scope.
If you open up the image you’ll see something like this, where the line doesn’t extend all the way to the edges.
Now we can start creating some patterns. We’ll start with the square grid because its slightly simpler. First we need to decide what size of grid we want to create. The one I showed a screenshot of near the top used half centimeter spacing. ESVG provides a collection of conversion functions in the convert module. The useful one for us here is parse_length. This will take a string like 0.5cm or 2.25in and convert it into a number of pixels. With that number of pixels for the grid we can work out how many rows and columns we should have for the given page.
fn main() {
    let page = Page::A4(DPI);
    let mut document = create_document(&page);

    let grid_spacing = convert::parse_length("0.5cm", DPI).expect("could not parse length");

    let num_rows = page.display_height_px() / grid_spacing;
    let num_columns = page.display_width_px() / grid_spacing;

    esvg::save("output_path.svg", &document).expect("Could not save SVG");
}
Now we can start actually using the polygonical library. We need to work out a grid of points across the page. We can use a pair of for loops to do the rows and columns. Then we need to create a Point on the page where we want to draw a corner.
Point is the most basic type in polygonical. It represents a point in 2d space. The page.top_left() function we used earlier returns one, but we didn’t need to worry about it then. They have an x and y value and can be translated or moved by other points, rotated around the origin.
Lets have a look at the code and then go through the important parts.
fn main() {
    let page = Page::A4(DPI);
    let mut document = create_document(&page);

    let grid_spacing = convert::parse_length("0.5cm", DPI).expect("could not parse length");

    let num_rows = page.display_height_px() / grid_spacing;
    let num_columns = page.display_width_px() / grid_spacing;

    for y in 0..num_rows {
        for x in 0..num_columns {
            let point = page
                .top_left()
                .translate(&Point::new(x * grid_spacing, y * grid_spacing));

            let circle = esvg::shapes::circle(point, grid_spacing / 5);
            document.add(&circle);
        }
    }

    esvg::save("output_path.svg", &document).expect("Could not save SVG");
}
In the middle of that code we work out the point we want to draw a circle.
let point = page
    .top_left()
    .translate(&Point::new(x * grid_spacing, y * grid_spacing));
This takes the point of the top left of the page, then moves it by a new point with its x and y coords set appropriately. We could keep a running variable and move it by grid_spacing each iteration but I find this slightly easier to understand personally.
After that we create a circle element and add it to the document, just like we did with our line previously. If we run this we should see something like this

Note that we have what looks like different margins on the right and bottom. This is because we are creating one less than the rows and columns calculated at the start. It’ll become clear why later.
Let’s draw some lines. We’ve already seen how to do this so all we need is the end point of the line and we can create these reasonably easily. For each point we visit, if we draw a line to the right and a line downwards we will end up with a nice grid. While yes, we could draw lines all the way along the page and have a smaller SVG at the end, later we are going to want to be able to turn individual sections off so this will be easier if we do it like this.
fn main() {
    let page = Page::A4(DPI);
    let mut document = create_document(&page);

    let grid_spacing = convert::parse_length("0.5cm", DPI).expect("could not parse length");

    let num_rows = page.display_height_px() / grid_spacing;
    let num_columns = page.display_width_px() / grid_spacing;

    let move_right = Point::new(grid_spacing, 0);
    let move_down = Point::new(0, grid_spacing);

    for y in 0..num_rows {
        for x in 0..num_columns {
            let point = page
                .top_left()
                .translate(&Point::new(x * grid_spacing, y * grid_spacing));

            let circle = esvg::shapes::circle(point, grid_spacing / 5);
            document.add(&circle);

            let right_point = point.translate(&move_right);
            let right_line = esvg::path::create(&[point, right_point]);
            document.add(&right_line);

            let down_point = point.translate(&move_down);
            let down_line = esvg::path::create(&[point, down_point]);
            document.add(&down_line);
        }
    }

    esvg::save("output_path.svg", &document).expect("Could not save SVG");
}
To save a bit on object churn I created a pair of points for moving right and moving down, so we could translate by the same points each time. There is nothing really stopping you creating new points in the loop, but I think this is a little clearer.
When you open this you’ll notice that the right and bottom edges are not filled in correctly. Lets take care of that now. There are a few ways we could do this. Extra loops after the main loop, or adding a check to see if we are on the last row, and increasing the iteration counts by one. This is what I’m going to go with.
fn main() {
    let page = Page::A4(DPI);
    let mut document = create_document(&page);

    let grid_spacing = convert::parse_length("0.5cm", DPI).expect("could not parse length");

    let num_rows = page.display_height_px() / grid_spacing;
    let num_columns = page.display_width_px() / grid_spacing;

    let move_right = Point::new(grid_spacing, 0);
    let move_down = Point::new(0, grid_spacing);

    for y in 0..=num_rows {
        for x in 0..=num_columns {
            let point = page
                .top_left()
                .translate(&Point::new(x * grid_spacing, y * grid_spacing));

            let circle = esvg::shapes::circle(point, grid_spacing / 5);
            document.add(&circle);

            if x < num_columns {
                let right_point = point.translate(&move_right);
                let right_line = esvg::path::create(&[point, right_point]);
                document.add(&right_line);
            }

            if y < num_rows {
                let down_point = point.translate(&move_down);
                let down_line = esvg::path::create(&[point, down_point]);
                document.add(&down_line);
            }
        }
    }

    esvg::save("output_path.svg", &document).expect("Could not save SVG");
}
Note that we switched from non inclusive ranges on the for loops to inclusive ranges. .. to ..=
Now that we have built the grid we can make it randomly decide to skip some of the entries. For this we will use the rand library. However, it would be good if we could get the same result repeatedly so that we can test things easily. For that we need a random number generator that we can seed with a known value. Rust’s rand crate doesn’t have one, so we’ll also need to bring in rand_chacha
cargo add rand
cargo add rand_chacha
Now we need to create a rng and then use it to decide if we want to render our lines and circles.
use esvg::page::Page;
use esvg::{Element, convert};
use polygonical::point::Point;
use rand::{Rng, SeedableRng as _};
use rand_chacha::ChaCha8Rng;

const DPI: i32 = 96;

fn main() {
    let page = Page::A4(DPI);
    let mut document = create_document(&page);

    let mut rng = ChaCha8Rng::seed_from_u64(123456789);
    let circle_chance = 0.5;
    let line_chance = 0.75;

    let grid_spacing = convert::parse_length("0.5cm", DPI).expect("could not parse length");

    let num_rows = page.display_height_px() / grid_spacing;
    let num_columns = page.display_width_px() / grid_spacing;

    let move_right = Point::new(grid_spacing, 0);
    let move_down = Point::new(0, grid_spacing);

    for y in 0..=num_rows {
        for x in 0..=num_columns {
            let point = page
                .top_left()
                .translate(&Point::new(x * grid_spacing, y * grid_spacing));

            if rng.random_bool(circle_chance) {
                let circle = esvg::shapes::circle(point, grid_spacing / 5);
                document.add(&circle);
            }

            if x < num_columns && rng.random_bool(line_chance) {
                let right_point = point.translate(&move_right);
                let right_line = esvg::path::create(&[point, right_point]);
                document.add(&right_line);
            }

            if y < num_rows && rng.random_bool(line_chance) {
                let down_point = point.translate(&move_down);
                let down_line = esvg::path::create(&[point, down_point]);
                document.add(&down_line);
            }
        }
    }

    esvg::save("output_path.svg", &document).expect("Could not save SVG");
}
Things to note here: we had to import SeedableRng to get the trait that allows us to set the seed on the chacha8 random number generator. The rng has to be mutable, its internal state gets updated when it generates a random number so that the next one is different. I created two variables to hold the probability of lines and circles being created, this just makes it easier to alter them when playing around.
Now when we run this we should get something that looks like this
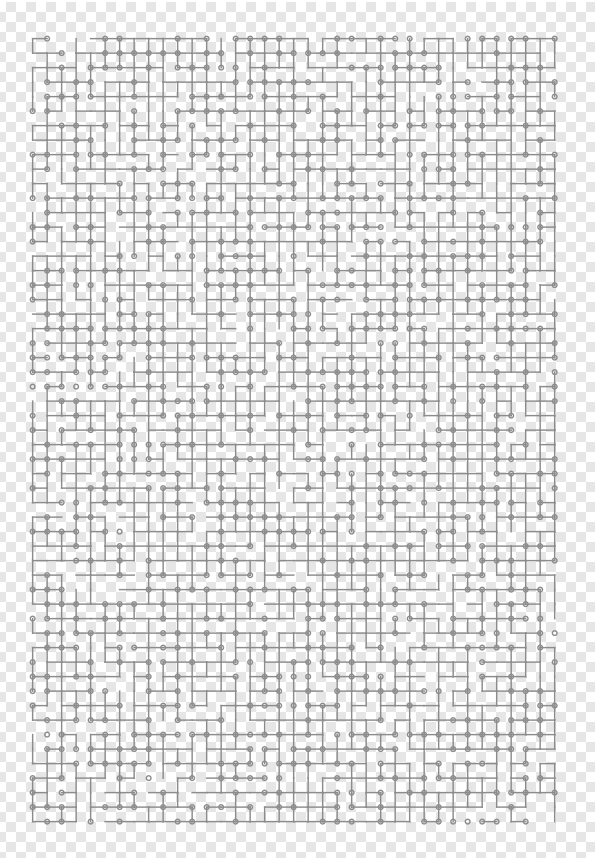
There is still plenty to do to this little program. Command line arguments, tidying up into functions, but the core is there. It produces the output we wanted. Hopefully its given you a small taste of whats possible when programmatically creating SVG files.
If you give this a try I’d love to see the things you create. Drop me a message on mastodon